Run from Dashboard
A visual interface to configure runs and explore results. No command line required.
Note
The Dashboard is still under development. If a run fails or produces unexpected results, use the command line and .log files to diagnose the issue. See Debugging.
Launch the dashboard
From your EPM folder:
Then open your browser at http://localhost:8050.
Workflow
1. Select your input data
Upload or select your input folder from the left panel. The dashboard validates your data and highlights any missing or inconsistent inputs.
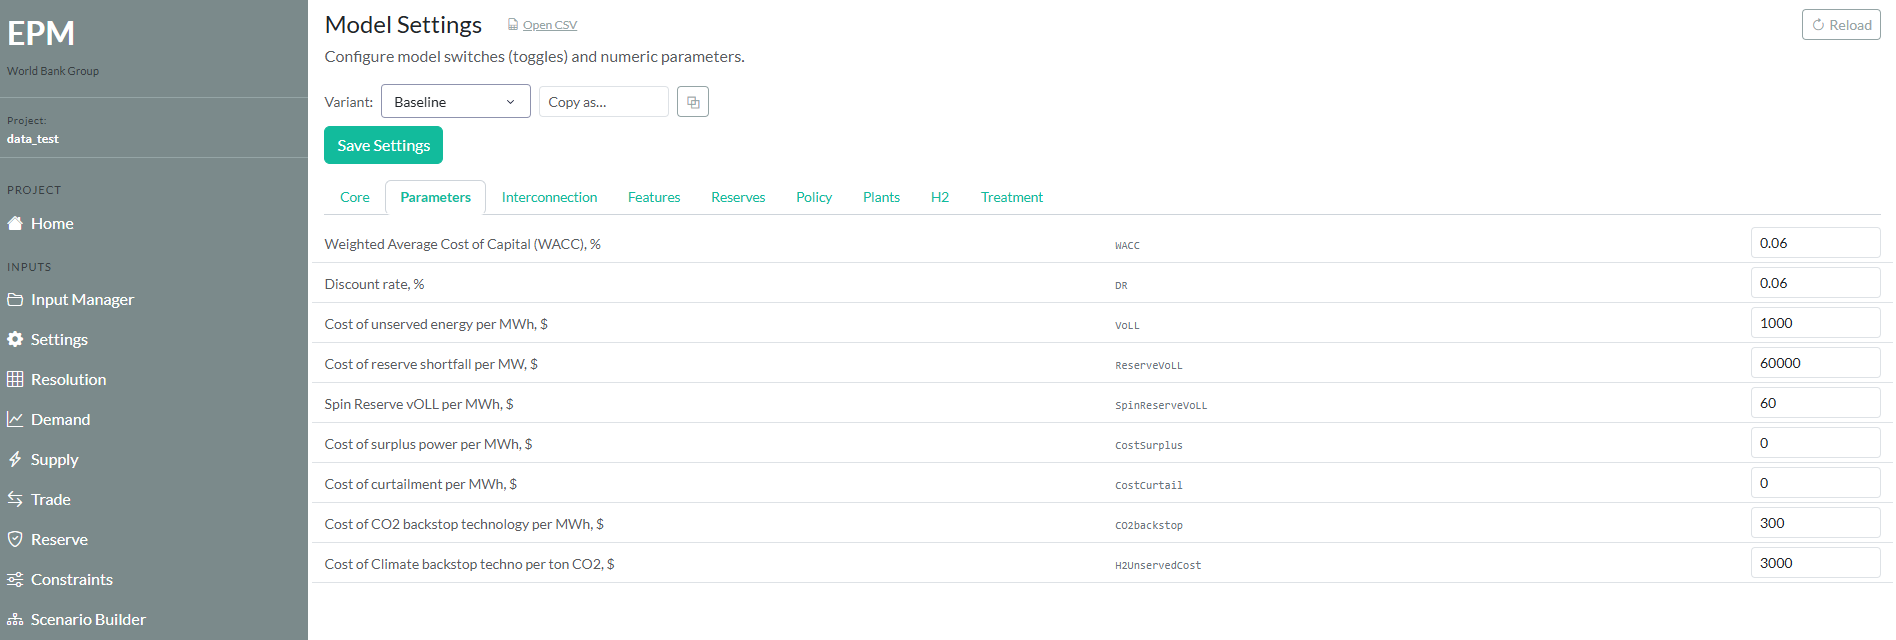
2. Configure your run
Set key parameters directly from the interface: model type (MIP / RMIP), number of scenarios, CPU cores.
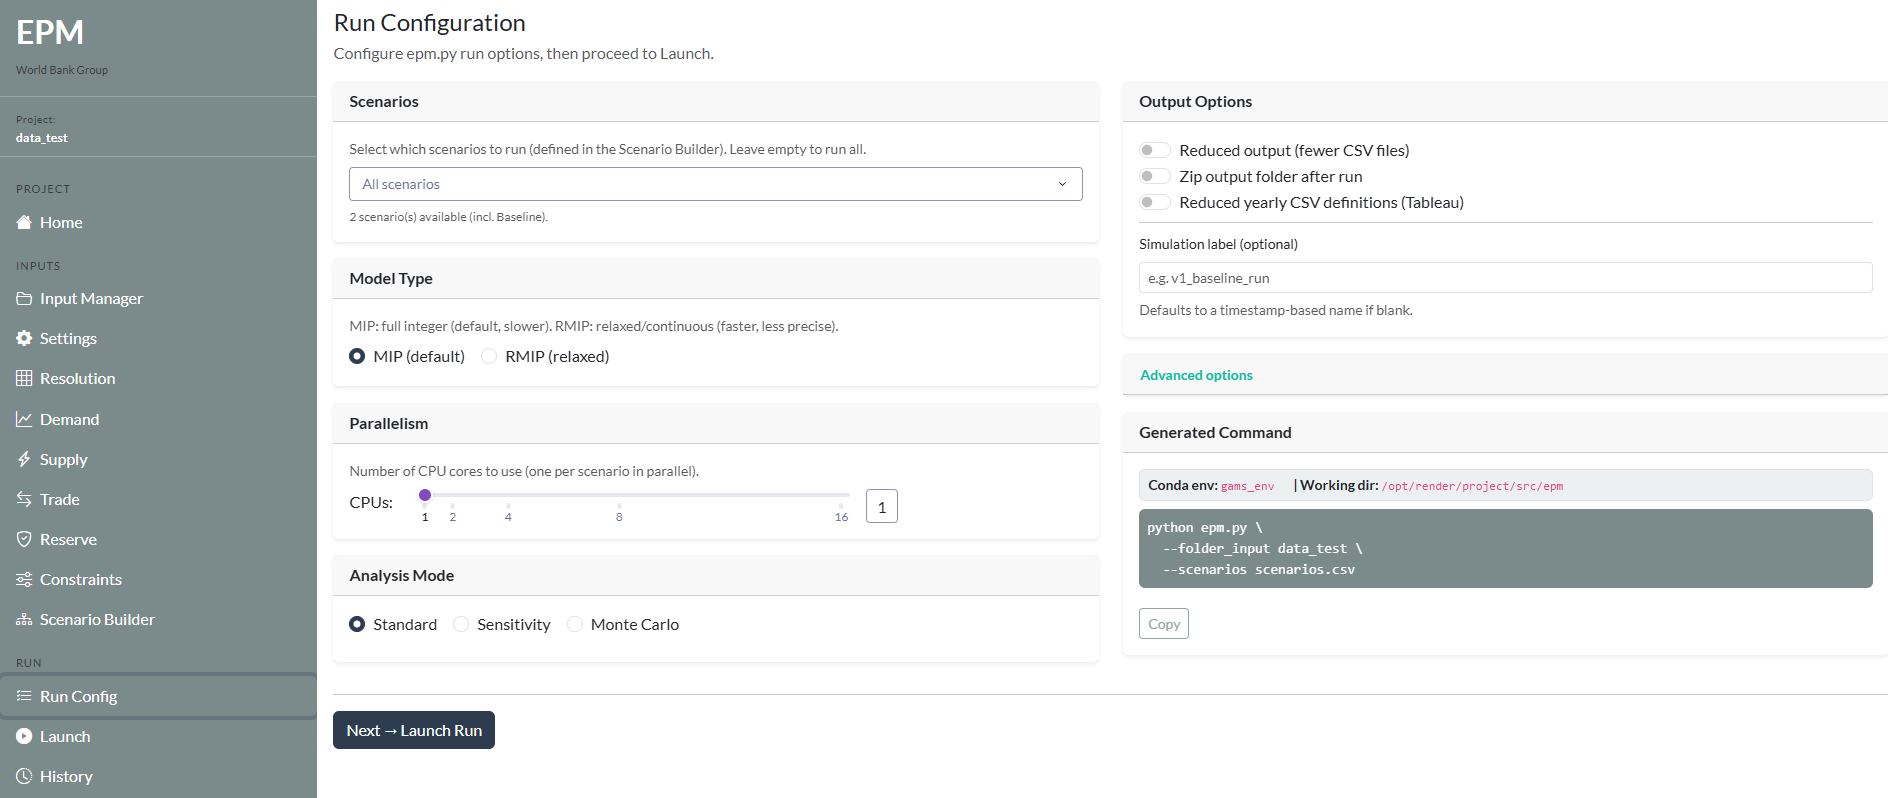
3. Run EPM
Click Run to launch the model. The interface will indicate that the run is in progress. If the run fails, switch to the command line to see the full error output. See Debugging.
4. Explore results
Once the run completes, navigate the built-in charts: capacity expansion by technology and year, generation dispatch, costs breakdown, emissions trajectory.
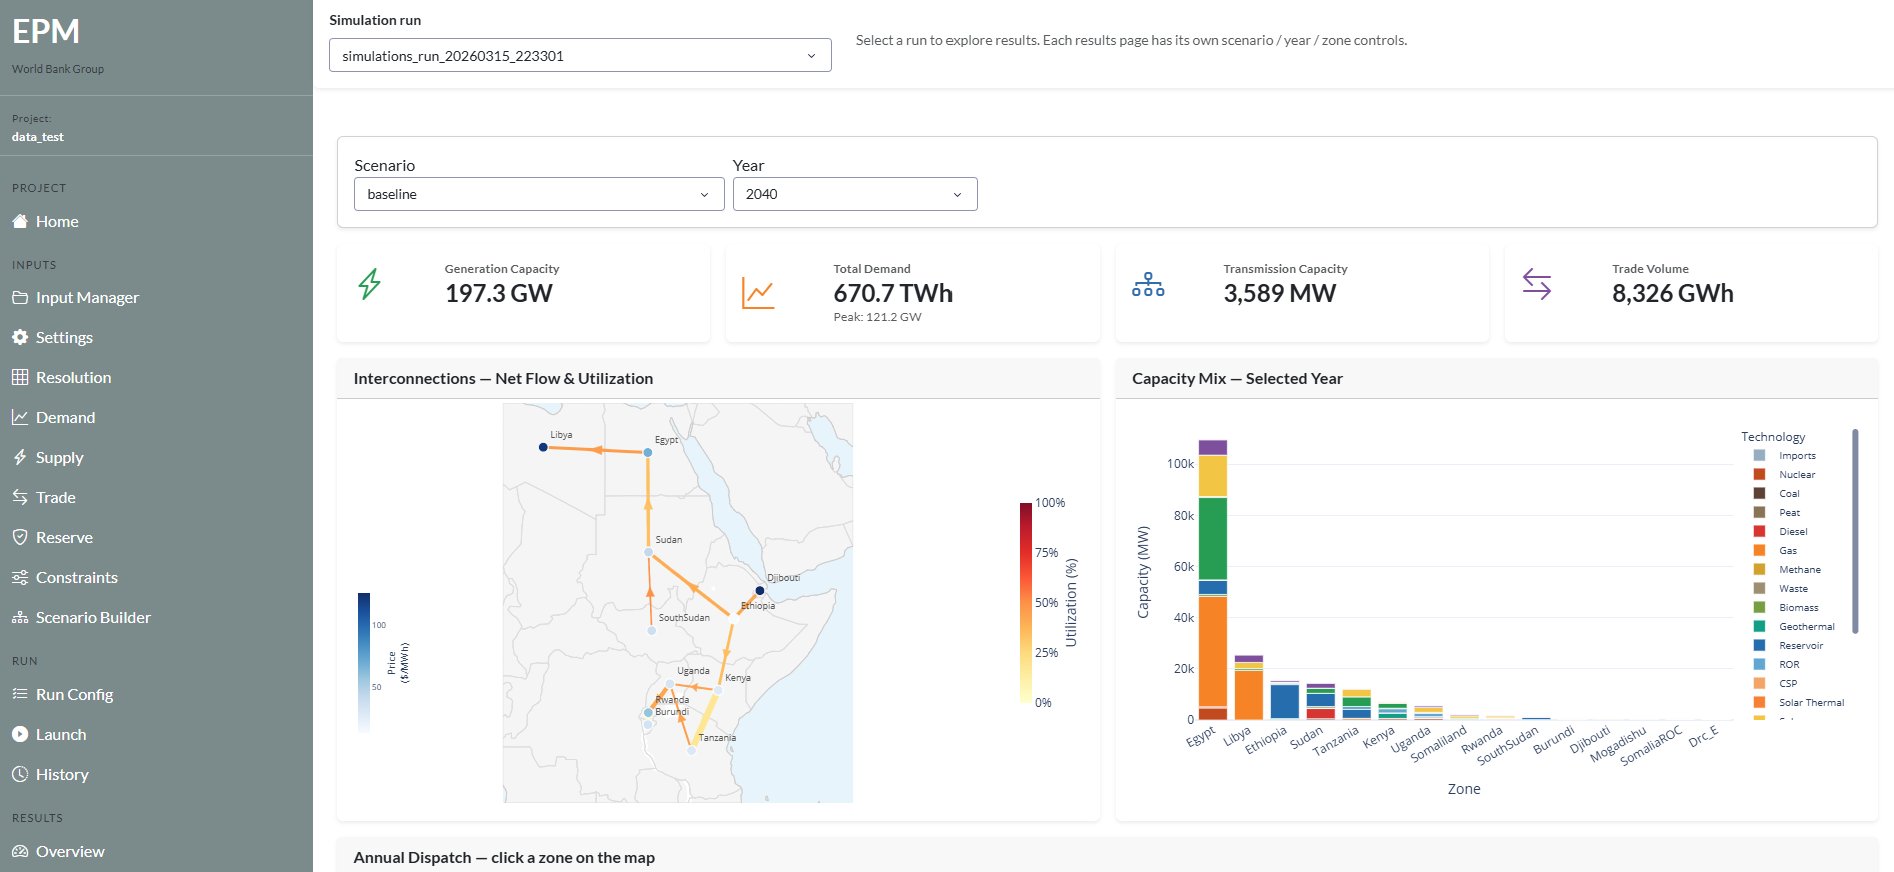
Results are also saved to output/ as CSV files for use in Tableau or Python.
Requirements
- EPM installed (Installation)
- Python environment active (
epm_env) - Dashboard dependencies installed (included in
requirements.txt)